SEARCH BY KEYWORDS, SUBJECT, PEOPLE AND HIT ENTER
Pinpointing 'pollution hotspots' in Oxford
A joint project between Dr Felix Leach of the Oxford University Department of Engineering Science, Cambustion, Oxford Bus Company, and Oxford City Council to measure NOx emissions from buses in service in Oxford was conducted in June 2018.
Oxford Emissions Maps
Oxford Bus Company were eager participants, providing two in service buses – a Euro V hybrid bus and a more modern Euro VI bus. Phil Southall, Managing Director 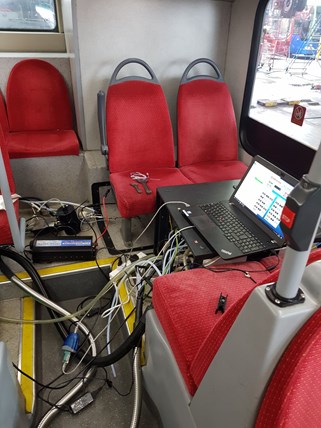 of Oxford Bus Company, said “As a bus operator Oxford Bus Company have always prided ourselves as being at the forefront of leading the UK on environmental technology innovation”
Councillor Tom Hayes, Executive Board Member for Safer and Greener Environment for Oxford City Council, said: “Oxford Bus Company doesn’t just help tens of thousands of people travel from A to B every year, they also run an impressive environmentally responsible business. Every move we make to clean up our toxic and illegal air has to be led by the evidence, so I’m thrilled that Oxford City Council is working with the University of Oxford University and a company with a strong track record of cutting emissions.
Cambustion’s fast emissions measurement technology, combined with very high accuracy GPS, was used to measure NOx emissions with an accuracy of around 10cm – this enables identification of exactly where NOx was emitted, and what caused that emission. This data can then be used to identify urban NOx hot-spots, and their cause. In the future this may lead not only to vehicle improvements but also urban environment improvements (such as road layouts) to further reduce NOx emissions in the city.
A Euro VI bus stop manoeuvre
About the tests
Two buses were tested over several routes. The resulting emissions maps can be found below.
Euro V bus
- Euro V bus Morning 35A X3 - Bus garage - Kennington - Matthew Arnold School - Abingdon - Oxford City Centre - Bus garage
- Euro V bus Afternoon 35A 13 - Bus garage - Kennington - Matthew Arnold School - Oxford City Centre - JR Hospital - Oxford City Centre - JR Hospital
Euro VI bus
- Euro VI bus garage - route start - The route from the bus garage to the start of route - this includes cold-start emissions
- Euro VI bus City 5 North run 1 - A northbound City 5 run from Blackbird Leys to Oxford Rail Station
- Euro VI bus City 5 South run 1 - A southbound City 5 run from Oxford Rail Station to Blackbird Leys
- Euro VI bus City 5 North run 2 - A northbound City 5 run from Blackbird Leys to Oxford Rail Station
- Euro VI bus City 5 South run 2 - A southbound City 5 run from Oxford Rail Station to Blackbird Leys
- Euro VI bus City 5 North run 3 - A northbound City 5 run from Blackbird Leys to Oxford Rail Station
Euro V car
- Euro V car - Replicating the bus routes as if a taxi
Comparisons between the three vehicles we tested at idle are shown below. Of particular interest was that, at idle, turning the air conditioning of the Euro 5 car on (it was a hot summer day) nearly doubled the NOx emitted.
|
EU V hybrid bus |
EU VI bus |
EU 5 car |
|
|
Passenger capacity |
73 |
101 |
7 |
|
Engine capacity |
4.76 l |
5.1 l |
2 l |
|
NOx ppm |
350 |
100 |
110 / 190* |
|
NOx g/h |
66 |
20 |
8 / 15* |
|
NOx per passenger g/h |
0.90 |
0.20 |
1.14 / 2.14* |
*Air con off / on
The whole team are delighted to be able to publish the emissions maps from these tests. You can zoom these to see exactly where the urban NOx hot-spots we found are likely to be.
The maps
A note of caution:
These maps measure volume concentration of NOx (the scale of them all is in parts per million volume), not the mass which was emitted (which will depend on engine load), therefore whilst they are of value comparatively they do not represent a legislatively compliant emissions test, nor can they tell how much mass of NOx was emitted, and should not be interpreted as such. They are results only true of the vehicles we tested on the day that we tested their emissions, and should not be seen as representative of every bus or car driving in Oxford. All of the maps are fully zoomable – so do use your mouse wheel to zoom and see the full detail (down to ~10cm) of the NOx emissions.